Aws Serverless Sump Chart
AWS Serverless Sump Chart
I have developed my own Sump Chart website, that involves Raspi for monitoring, Java server for processing and storing data, and Streamlit for data visualization. Those are all meant to imitate a large scale IoT data processing system. This is all good, however, after learning various AWS capability, I decided to attempt to make the whole system run serverless. It will heavily rely on AWS capability, but will be cost less for a relatively simple data visualization project.
Key AWS Capability:
- S3 as a static web site
- Lambda for data processing and charting
The plan
(To be updated as necessary)
IoT –> DynamoDB
RaspberryPi python/shell script –> DynamoDB. RaspberryPi Sump pump python code generates data point every minute and add it to a CSV file. I don’t want to change the python code as it’s an OSS software and want to keep it as original. So, I’d like to create code that reads the CSV file and upload to DynamoDB.
- Python or shell, or low level API
- Set up DynamoDB
- Set up API Gateway
- Sample curl command
- Shell script to take the last line of CSV, and upload using curl
- Run the script every minute
- Directly write to DynamoDB or let Lambda Function to handle with some filtering (e.g. anomaly data points).
- DynamoDB fields (attributes) - Timestamp, waterlevel e.g. 00:05:06,10.8 (date is from CSV file name)
IoT –> S3
Below, I changed my plan. The original idea was simply put the same CSV file as stored in RaspberryPi to S3. However, after researching and thinking through the system, decided to use DynamoDB instead.
Click to see original idea
Implementing a system that sends small data every minute and store it in a CSV file sounds inefficient as a long term solution. > The current [Sump Data](https://github.com/nobudev7/sumpdata) system used a RaspberryPi as a monitoring device, and sends the current water level every minutes to a server. On top, it sends 1 day worth of data to the same server in case there was any missing data points. > I will replace this with either IoT --> S3 directly. However, I might create a small Lambda Function if I find some processing necessary. > This needs a proper IAM setting for API access and permission. (To be documented later)Lambda Function
I’ll set up a Lambda function that is triggered by the new data on S3. It’ll be a process that takes the new data, and update the water level chart for the day. I might set this up such a way that it runs every time the new data is uploaded (= every minute), or perhaps only every 10 minutes, depending on the processing time and cost of Lambda.
Charting Java application
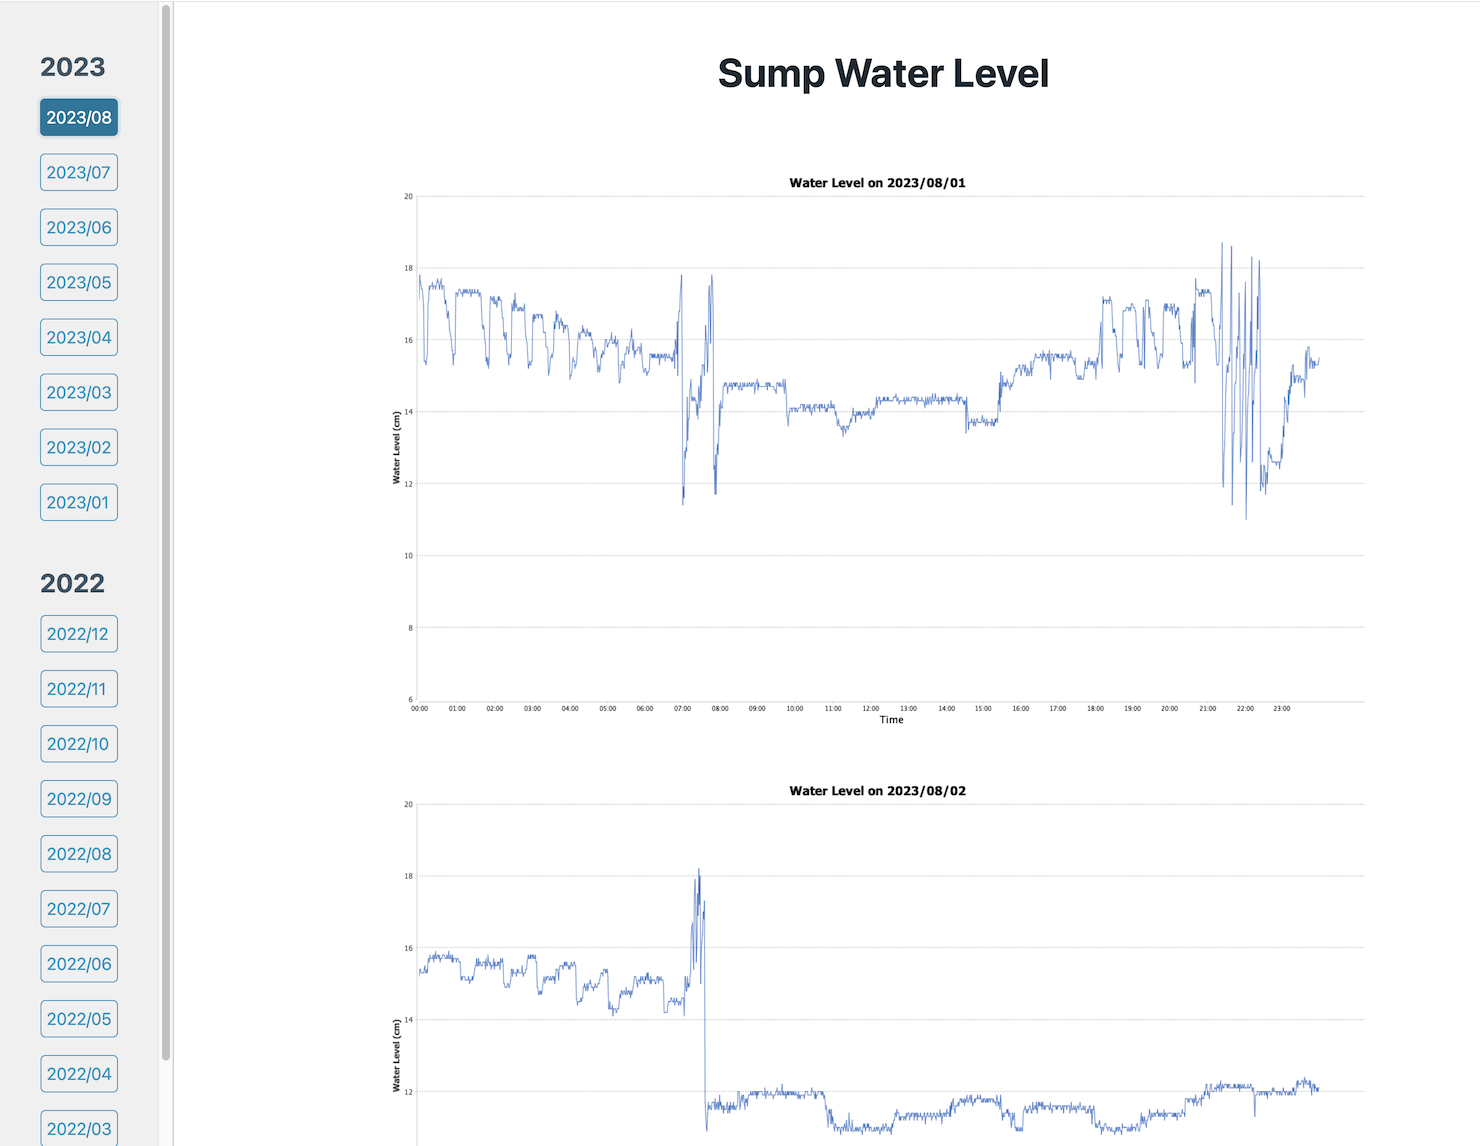
As the basis of the lambda function, I created a simple CLI Java application that takes CSV files, and output a chart per day to indicate the water level. Using Gemini as the AI tool, I vibe-coded a project that does that using JFree Chart.
The result is Sump Data Visualizer Cli, a Java command line tool that takes
Website
The current website is hosted on a Nginx server with Streamlit as a frontend visualization. The plan is to replace it with static S3 based website. The website is structured using Cloud Front and private S3 storage now, as described in Securing Serverless Site - Migrating From S3 Hosting To Amazon Cloudfront Https The above Lambda Function creates charts, and static HTML and CSS will be placed in a same folder that is exposed as a website. A small JavaScript code will get the most up-to-date list of charts, and show the year and month as the table of contents on the web page. It will look similar to the current website, however, everything will be statistically saved on S3, so where will be no server to maintain.